
Timing & Trust: What Change Frequency and Result Variability Tell Us About Bid Target Changes

A closer look at two findings from our research paper, Bid Target Change Magnitude & Paid Media Performance
Full methodology, statistics, and limitations are in the complete paper.
Automated bid strategies like Target CPA and Target ROAS are designed to adjust in response to performance, but marketers still have to make an important decision: when should you change the target, and how much should you change it?
Our original research examined 49 target changes across seven paid media campaigns, looking at both Target CPA and Target ROAS. We analyzed what happened after Minor and Major target changes, including short-term spend cooldowns, longer-term trends in conversion and efficiency, the effects of tightening versus loosening a target, and how the timing between successive changes impacts results.
The full research paper covers all of these findings. But two questions kept coming up in the conversations that followed: How often should you actually make a bid target change? And once you make one, how confident can you be that it will have the desired impact?
Those questions matter because automated bidding does not always behave as expected. A change can create a short-term disruption in spend before performance settles, making it easy to overreact to what happens in the first few days.
This article digs into those two questions, with a closer look at the supporting numbers and the practical takeaways for managing automated bid strategies.
Theme One: Change Frequency in Bid Target Changes
It's tempting to treat 'when' as a secondary question behind 'how much,' but the data says otherwise. Across the 45 changes in our dataset that had a prior change to measure against, the gap between changes ranged from 1 to 89 days, with a median of 14. Eight of those 45 changes (18%) landed less than 7 days after the one before it, concentrated in two campaigns (Cases E and G) that adjust their targets noticeably more often than the rest of the dataset.
Changing too soon costs you. Minor changes made within 7 days of a prior change averaged -11.1% conversion volume and +4.5 percentage points of distance-to-target improvement. Changes spaced 7 or more days apart averaged +1.2% volume and +6.2 percentage points of improvement, a meaningfully better outcome on both counts. What's notable is that the short-term spend pattern itself doesn't look more disrupted for these tight-gap changes; the dip-and-recovery shape is nearly identical to normal-gap changes. That points to the weaker outcome being a timing problem, not a shock problem: the change simply doesn't get enough runway to register before the next one overtakes it.
We'll flag the caveat up front, since it matters: this relationship is directionally present but falls short of conventional statistical significance (gap length vs. volume change: r=0.19, p=0.30; gap length vs. distance-to-target: r=-0.34, p=0.059), and it rests on only 6 tight-gap events. Treat it as a pattern worth watching rather than a settled fact.
Splitting the gap into three bands, fewer than 7 days, 7 to 14 days, and more than 14 days, sharpens the picture further, and rules out a simple 'the longer you wait, the better' explanation. The 7-to-14-day band comes out clearly on top: mean +9.2 percentage points and median +9.5 percentage points on distance-to-target, closely aligned with each other. The more-than-14-day band is actually the weakest of the three on this measure (mean +4.1 percentage points, median +1.3 percentage points), and that's not an outlier effect, it holds up on both the mean and the median. The fewer-than-7-day band lands in between on distance-to-target (mean +4.5 percentage points) but remains the weakest of the three on volume.

Figure 2. Distance-to-target improvement by days since the prior change, group median marked. The 7-to-14-day band leads clearly, with no single outlier driving the result.
Here's the part that makes the 7-to-14-day window especially worth building a habit around: it isn't just the best-performing band on average, it's also the most consistent one. Its distance-to-target results have roughly half the spread of the other two bands (standard deviation 6.6, versus 12.1 for gaps under 7 days and 12.3 for gaps over 14 days), and a meaningfully tighter volume spread as well (standard deviation 18.9 versus 24.5 and 25.3). A lever that performs well on average but swings wildly from case to case is a very different tool than one that reliably lands in a narrow range, and by that standard, the 7-to-14-day cadence is the more trustworthy of the three.

Figure 3. Spread of distance-to-target outcomes by frequency band (and direction), Minor changes. Notice the 7-to-14-day columns are visibly tighter than the columns on either side, regardless of direction.
Putting the average-outcome data and the consistency data together, the practical read is straightforward: changing too soon doesn't give a change time to register cleanly, and waiting too long lets other factors, seasonality, account drift, unrelated creative or budget changes, creep in and blur the read. The 7-to-14-day window looks like the range where you're mostly seeing the change's own effect, with the least noise mixed in.
Frequency takeaways
Give a change room to work before making another one: changes made within 7 days of a prior change trended toward weaker volume and efficiency outcomes, most likely because they don't get enough runway before being overtaken by the next change.
Aim for a 7-to-14-day cadence, not just "not too soon": this band is both the best-performing on average and the most consistent, with roughly half the outcome spread of changing sooner or later. If a change needs to be reliable, for example for a client-facing test, this is the safer cadence.
Don't treat "longer gap" as automatically safer: the more-than-14-day band was the weakest of the three on distance-to-target in this dataset, likely because more time gives more room for unrelated factors to muddy the comparison.
Sample-size caveat: the tight-gap comparison rests on just 6 reliable events, and the underlying correlations remain short of conventional statistical significance. This is worth monitoring as more data comes in, and is not yet a proven effect.
Theme Two: How Much Can You Trust the Result? Minor vs. Major Variability
Averages can be quietly misleading. A change that averages a great outcome but ranges wildly from case to case is a gamble dressed up as a strategy. So beyond asking what a Minor or Major change does on average, we asked a second question:
How much does the actual result vary from case to case, and does that answer differ by change size?
It does, substantially.
Minor changes are the more dependable of the two on every measure we looked at. Across the short-term spend pattern, all 43 Minor events in the dataset traced a similar shallow dip and quick recovery, tight enough that the average line is a fair representation of almost any individual event. Major changes tell a different story: the average across the 6 usable Major events shows a real, sustained cooldown, but the individual events underneath that average are noisy. One event (Case A's first Major change) actually spikes to over 300% of baseline by day 6, the opposite of a cooldown, even though the group average trends firmly downward.

Figure 4. Daily spend as a percentage of the 7-day pre-change baseline. The tight, consistent Minor line contrasts with the wider band of individual Major events (shown as thin reference lines) around the Major average.
The same pattern shows up in long-term outcomes, and it's most visible when you compare the mean to the median. For Minor changes, the two numbers stay close together: distance-to-target improved by a mean of +5.6 percentage points and a median of +5.7 percentage points, nearly identical, which tells you the average isn't being propped up or dragged down by a couple of extreme cases. For Major changes, the mean and median tell almost opposite stories: a mean of +13.7 percentage points looks like a solid win, but the median is actually -1.3 percentage points. That gap only happens when a couple of large outliers are doing all the work, in this case two very strong results from Case C pulling the average up while most other Major events sat flat or negative.
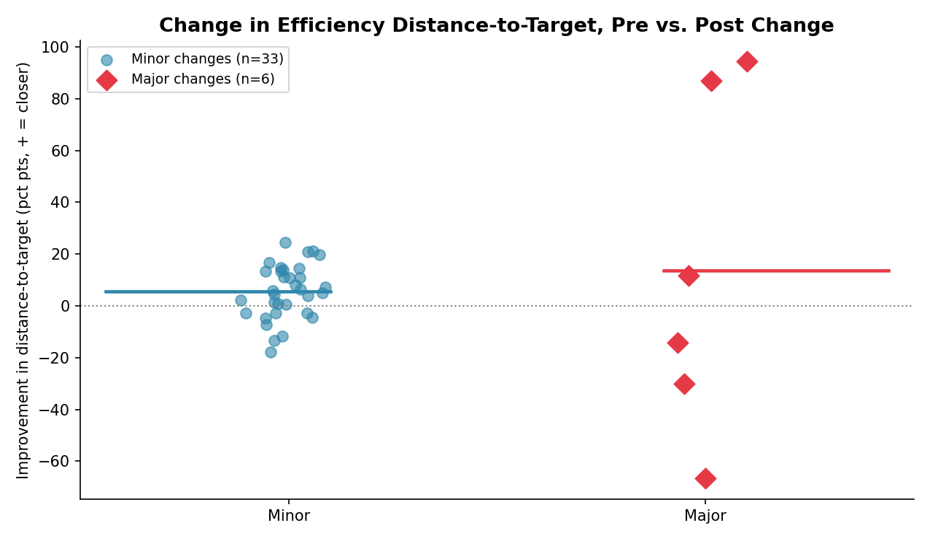
Figure 5. Change in distance-to-target, pre- vs. post-change window. The Minor cluster sits in a relatively narrow band; the Major points are spread from a 30-point loss to a 94-point gain.
Volume tells the same story from a different angle. Minor changes average close to flat (+1.6%) with results split almost exactly 50/50 between gains and losses, again, an average that's genuinely representative of most individual cases. Major changes average -13.6%, but individual results range from a 89.4% drop to a 28.9% gain, an enormous spread for just six events. Overall, Major changes land close to a coin flip on outcome direction: 3 of 6 improved distance-to-target and 3 of 6 gained volume, and notably, not always the same three events. There is no reliable directional edge from simply making a Major change; the specific case and the direction of the target move seem to matter more than the Major/Minor label itself.

Figure 6. Change in average daily conversions, pre- vs. post-change window. The Minor cluster is comparatively tight; the Major points range from a steep drop to a solid gain.
Variability takeaways
Minor changes are the low-risk, dependable lever: a shallow, short spend dip (2 to 3 days) with quick recovery, and outcomes that cluster closely enough around the average to trust it. A reasonable default for routine optimization.
Major changes carry real, and unpredictable, risk: average spend stays below baseline for essentially the whole 14-day window, bottoming near 45% around day 9 to 10, but individual events range from a deep, sustained cooldown to no cooldown at all. Build in a 10-to-14-plus day monitoring window before judging any single Major change, and don't assume one event's outcome predicts the next.
Treat Major-change averages with real caution: when the mean and median disagree as sharply as they do here (+13.7pp vs. -1.3pp on efficiency), the average is being carried by a small number of outlier cases, not describing a typical result.
Consider whether a sequence of Minor changes gets you there more reliably: with less disruption and a narrower range of likely outcomes than a single Major change, especially when the target move is large enough that either approach could work.
Small-sample caveat: this comparison rests on 6 usable Major events against 43 Minor events. That's enough to see a consistent pattern in variability, Major results really are more scattered, but not enough for strong statistical confidence in the long-term volume and efficiency splits. A single additional case could still shift the picture, and we're actively working to grow the Major-change sample.
Want the full picture, including the short-term cooldown analysis, the tightening-vs-loosening breakdown, and every limitation we flagged? Read the complete research paper.


