
Bid Target Change Magnitude & Paid Media Performance

How the Size of a Target CPA / Target ROAS Change Shapes Short- and Long-Term Paid Media Campaign Outcomes
An Empirical, Multi-Campaign Case Study
Abstract
Automated bid strategies such as Target CPA and Target ROAS are typically managed through periodic adjustments to the target value. However, practitioners have limited empirical guidance on how the magnitude of those adjustments, whether Minor or Major, affects campaign performance. This study examines seven paid media campaigns (Cases A through G) using both Target CPA and Target ROAS strategies to assess how change magnitude affects short-term spend stability and longer-term conversion volume and efficiency. Daily spend, conversions, and conversion value were tracked across 49 discrete target changes.
Minor changes produced a brief, shallow dip in daily spend that recovered within three to four days. They showed no consistent increase or decrease in average volume but moved performance closer to the target in approximately seven of ten cases. Major changes produced a deeper and more prolonged spend cooldown that had not fully recovered after 14 days in this dataset, with substantially less predictable effects on volume and efficiency.
Two additional factors materially influenced outcomes: the direction of the change (tightening versus loosening the target) and the cadence between successive changes. Loosening a target consistently increased volume, while tightening consistently suppressed it. A 7-to-14-day interval between changes emerged as both the best-performing and most consistent cadence observed.
These findings are translated into a practical decision framework for teams managing automated bid strategies, alongside a discussion of the study's limitations.
Introduction
Target CPA and Target ROAS are among the most widely used automated bid strategies in paid media, and adjusting the target is one of the primary levers available to a media buyer once a campaign is live. In practice, that adjustment can range from a small nudge, a few percentage points toward a more or less aggressive goal, to a large, deliberate reset of the target. Both are common, and both are used for different reasons: a Minor change is often a routine tuning move, while a Major change is typically a response to a shift in business goals, margin targets, or account strategy.
What is less well understood, and rarely documented empirically, is how the size of that change shapes what happens next. Does a larger change simply produce a larger version of the same effect, or does it behave differently in kind, not just degree, than a small one? Does spend recover quickly regardless of change size, or does a bigger adjustment to the algorithm's target take meaningfully longer to settle? And does the direction of the change, tightening toward a harder goal versus loosening toward an easier one, matter as much as its size?
This paper addresses those questions using observed daily performance data from seven live paid media campaigns spanning across different business models, sales processes, and industries. Rather than relying on a single case or a controlled experiment, we look for patterns that recur across multiple independent campaigns, treating consistency across cases as a form of validation given the inherent noise of live account data. Because each campaign has its own baseline performance, cost structure, and conversion volume, we do not compare absolute performance across campaigns; instead, we compare each campaign against its own pre-change baseline and look at whether the same directional pattern shows up repeatedly.
Methodology
Dataset and Scope
The dataset covers various paid media campaigns, each tracked at the campaign, day-level with daily cost, conversions, conversion value, and the active Target CPA or Target ROAS value.
Of the seven cases, Cases D through G contain Minor changes only, with no Major changes recorded in the window analyzed. Cases A and C shifted almost entirely to Major changes, leaving few reliable Minor events; the Minor-change comparison is therefore carried mainly by Cases B, D, E, F, and G. In total, the dataset includes 49 independent events. Because each case represents a distinct campaign with its own baseline performance, we do not compare absolute results across cases; instead, we look for consistent directional patterns that repeat across multiple independent campaigns.
Analytical Approach
Short-term (cooldown): daily spend is indexed to the average of the seven days immediately preceding each change (100 = normal) and tracked day-by-day afterward, capped at the next change or the end of the available data.
Long-term (volume and efficiency): for each change, the full window until the next change (or the end of data) is compared against that same seven-day pre-change baseline, on two measures: average daily conversions (volume) and actual CPA/ROAS relative to target ('distance-to-target').
Bid strategy type: Target CPA and Target ROAS campaigns are pooled by default rather than analyzed separately, consistent with this study's focus on the overall effect of change magnitude rather than strategy-specific effects.
Inclusion threshold: only change events with at least seven days of prior data are included, so that every event has a genuine baseline to compare against.
Results
Short-Term Spend Cooldown
Minor changes show a brief, shallow dip followed by a quick recovery. Average spend drops to roughly 86 to 89 percent of baseline by day 2 to 3, then recovers to 100 percent or above by day 4 and holds there, a pattern consistent across all 43 Minor events in the dataset.
Major changes show a deeper and more sustained cooldown. Across the 6 usable Major events, the average Major-change line sits below the Minor line for essentially the entire 14-day window observed, mostly in the 45 to 93 percent range, bottoming around day 9 to 10, and never fully recovering to 100 percent within the window. Individual events remain noisy, one event (Case A's first Major change) spikes to over 300 percent of baseline by day 6, but the average across all six events is a clear and consistent signal.
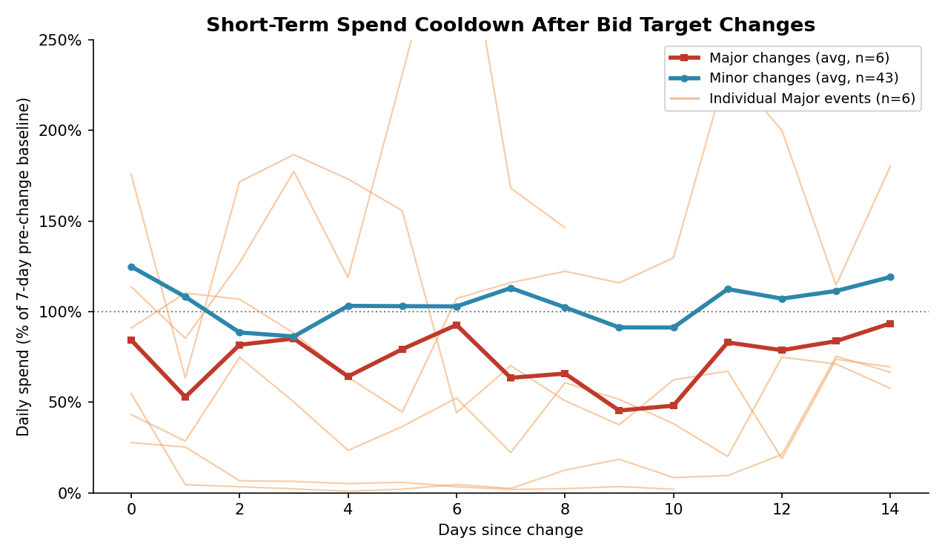
Figure 1. Daily spend as a percentage of the 7-day pre-change baseline. The Minor line is an average across 43 events; the Major line is an average across 6 events, with individual Major events shown as thin reference lines.
Long-Term Volume and Efficiency
Volume impact: across the 33 Minor-change events with a reliable (7-plus day) post-window, average daily conversion volume change is close to flat (mean +1.6%, median -3.2%), with results split almost exactly 50/50 between gains and losses (48% positive). On their own,
Minor changes do not show a clear, dependable volume tailwind or tax as it is dependent upon the direction of the change (addressed later).
Efficiency (distance-to-target): Minor changes moved performance closer to target in 73 percent of reliable events (mean +5.6 percentage points, median +5.7 percentage points, values close enough together that the result is not being driven by an outlier). Major changes average -13.6% volume (median -2.1%) and are split on distance-to-target: the mean of +13.7 percentage points looks positive, but the median is actually -1.3 percentage points, with individual results ranging from a 30-percentage-point worsening (Case A) to a 94-percentage-point improvement (Case C). Major changes remain the least predictable lever in this dataset, with no consistent direction in efficiency.

Figure 2. Change in distance-to-target (percentage points), pre- vs. post-change window. Positive values indicate movement closer to target.

Figure 3. Change in average daily conversions, pre- vs. post-change window.
Change Frequency
Across the 45 changes that had a prior change to measure against, the gap between changes ranges from 1 to 89 days (median 14). Eight of 45 changes (18%) landed less than 7 days after the previous change, concentrated in Cases E and G, which change targets noticeably more often than the others.
Minor changes that followed a prior change within 7 days show a weaker average outcome: -11.1% volume and +4.5 percentage points of distance-to-target improvement (n=6, reliable post-windows), versus +1.2% volume and +6.2 percentage points of improvement for changes spaced 7 or more days apart (n=25).
The relationship is directionally present across the full set but falls short of conventional statistical significance (gap length vs. volume change: r=0.19, p=0.30; gap length vs. distance-to-target: r=-0.34, p=0.059), and with only 6 tight-gap events, this remains a pattern worth monitoring rather than a proven effect.
Splitting the gap into three bands (fewer than 7 days, 7 to 14 days, and more than 14 days since the prior change) confirms the relationship is not a simple 'the longer you wait, the better' pattern. The 7-to-14-day band comes out clearly on top: mean +9.2 percentage points and median +9.5 percentage points, closely aligned. The more-than-14-day band is the weakest of the three on distance-to-target (mean +4.1 percentage points, median +1.3 percentage points), and this result is not driven by a single outlier. The fewer-than-7-day band sits in between on this measure (mean +4.5 percentage points, median +3.3 percentage points) but remains the weakest on volume.

Figure 4. Distance-to-target improvement per event by days since the prior change, with group mean marked.

Figure 5. Same data with group median marked; the 7-to-14-day band leads on both mean and median, with the more-than-14-day band clearly weaker on this measure and no single outlier driving the gap.
This pattern supports the case for a practical middle ground: enough runway for a change to register, but not so long that drift, seasonality, or other confounders begin to dominate the comparison. With n=6, 10, and 15 across the three bands, sample size remains modest, but the 7-to-14-day advantage is visible on both mean and median without an outlier explanation and is worth treating as a genuine early signal.
Tightening vs. Loosening the Target
Splitting changes by direction, tightening (a lower CPA target or a higher ROAS target, i.e. a harder goal) versus loosening (a higher CPA target or a lower ROAS target, i.e. an easier goal), reveals the clearest and most consistent pattern in this dataset for Minor changes.
Short-term: tightening changes suppress spend for the full 14-day window observed, mostly running at 60 to 100 percent of baseline with no clean recovery back to 100 percent.
Loosening changes do the opposite: spend runs above baseline for almost the entire window, mostly in the 110 to 145 percent range. The overall 'brief dip, full recovery' shape shown for Minor changes in Figure 1 is, in effect, an average of these two offsetting patterns rather than a shape either direction shows on its own.

Figure 6. Daily spend as a percentage of the 7-day pre-change baseline, Minor changes split by direction.
Long-term: tightening changes (n=18) average -9.0% conversion volume, with only 22 percent landing positive. Loosening changes (n=13) average +15.7% volume, with 85 percent landing positive. Both directions still improve distance-to-target on average (tightening +3.6 percentage points, loosening +8.5 percentage points), so loosening is not simply a 'free' efficiency loss in this dataset either; it tends to gain volume without giving back much ground on target-fit.

Figure 7. Change in average daily conversions, pre- vs. post-change, split by direction. All 6 Major events happened to be tightening changes, shown here for reference only.

Figure 8. Improvement in distance-to-target, pre- vs. post-change, split by direction. Loosening edges out tightening here as well (median +13.3 percentage points vs. +4.7 percentage points): loosening is not just a volume play; it also tends to land closer to target more often. The Major group's mean (+13.7 percentage points) is pulled well above its median (-1.3 percentage points) by two large outliers from Case C, so that mean should be treated with caution.
One gap remains in this dataset: all 6 Major changes were tightening changes, so there is no Major-loosening example to compare against. Notably, the Major-tightening average volume change (-13.6%) lines up fairly closely with the Minor-tightening average (-9.0%), suggesting that the tighten/loosen direction may matter more for volume than the Major/Minor size label does (see Figure 8). Whether Major loosening behaves like Minor loosening, producing a volume lift, remains unknown from this dataset.
Variability by Change Frequency and Direction
Beyond average outcomes, it is worth asking how consistent those outcomes are: a lever that performs well on average but with wide variance is a different kind of tool than one that reliably lands in a narrow range. Crossing the frequency bands from the previous section with the tighten/loosen split (Minor changes only) shows that the 7-to-14-day band is not just the best performer on average, it is also the most consistent, across both directions and both metrics.
Direction alone: tightening has a tighter spread than loosening on both measures (volume standard deviation 15.2 vs. 19.1; distance-to-target standard deviation 9.1 vs. 12.6).
Loosening carries the better average outcome but also more variance around it, a higher-risk, higher-reward lever rather than a free win.
Frequency alone: the 7-to-14-day band has roughly half the distance-to-target spread of the other two bands (standard deviation 6.6, versus 12.1 for fewer than 7 days and 12.3 for more than 14 days), and a meaningfully tighter volume spread as well (standard deviation 18.9 versus 24.5 and 25.3).

Figure 9. Spread of volume outcomes by frequency band and direction, Minor changes. Box = interquartile range, line = median, whiskers = full range, points = individual events.

Figure 10. Spread of distance-to-target outcomes by frequency band and direction, Minor changes. Same layout as Figure 9.
Crossing the two dimensions (small cells, n=2 to 7 each, best read directionally) shows the pattern holds for both directions: at 7 to 14 days, loosening events cluster tightly in a +6% to +14% volume band and a +9-to-21-percentage-point distance-to-target band, versus much wider swings (roughly -12% to +60% volume) at under 7 and over 14 days. Tightening shows the same tightening effect at 7 to 14 days, though with a smaller sample. The practical read is that changing too soon (under 7 days) does not give a change time to register cleanly, while waiting too long (over 14 days) likely allows other factors, seasonality, drift, account changes, to blur the read. The 7-to-14-day window appears to be the range in which the change's own effect is visible with the least noise mixed in.
Discussion: A Practical Decision Framework
The patterns above translate into a set of practical guidelines for teams deciding when, and by how much, to adjust an automated bid target.
Minor changes are low-risk operationally: expect a shallow, short dip in spend (2 to 3 days) with quick recovery, and no reliable, predictable major swing in conversion volume. They are a reasonable default lever for routine optimization.
Minor changes tend to nudge efficiency closer to target: roughly 7 in 10 Minor changes in this dataset moved performance closer to target, though the effect size per change is modest (about 6 percentage points on average). Treat them as steady, incremental tuning rather than a fast fix.
Major changes carry real short-term spend risk: average spend across all 6 Major events stays below the 7-day pre-change baseline for essentially the entire 14-day window, bottoming near 45 percent around day 9 to 10. Build in a 10-to-14-plus day monitoring window before judging a Major change.
Major changes are close to a coin flip on outcome direction: 3 of 6 Major events improved distance-to-target and 3 of 6 gained volume (not always the same three events). There is no reliable directional edge from simply making a Major change; the specific campaign and the direction of the target move appear to matter more than the Major/Minor label itself.
Consider whether a sequence of Minor changes can reach the same target: with less disruption than a single Major change. The short-term spend risk observed here is a fairly consistent feature of Major changes across strategy types, not limited to Target CPA.
Give a change room to work before making another one: Minor changes made within 7 days of a prior change trended toward weaker volume and efficiency outcomes, likely because they do not get enough runway before being overtaken by the next change. The 7-to-14-day gap band shows the strongest results on both mean and median distance-to-target improvement, with no outlier propping it up. A reasonable rule of thumb is to space Minor changes roughly 7 to 14 days apart.
For the most predictable results, aim for a 7-to-14-day change cadence: rather than simply 'not too soon.' This band is not only the best-performing on average, it is also the most consistent, with roughly half the outcome spread of changing sooner or later, for both tightening and loosening. If a change needs to be reliable, for example in a client-facing test, 7 to 14 days between changes is the safer cadence; changing sooner or waiting much longer both widen the range of plausible outcomes.
Limitations and Caveats
Small Major-change sample: 6 usable Major events across the whole dataset is enough to see a consistent short-term cooldown pattern, but not enough for strong statistical confidence on the long-term volume and efficiency splits. A single additional case could still shift the picture.
No adjustment for seasonality, account maturity, or concurrent non-bid changes (creative, budget, audience), any of which could confound the patterns shown here.
Cross-case comparisons are directional only: consistent with the dataset's scope, absolute performance is not compared across cases; only whether the same pattern shows up repeatedly.
Change-frequency effect rests on only 6 reliable tight-gap (under 7 day) Minor events. The gap-length-vs-volume correlation remains non-significant (r=0.19, p=0.30); the gap-length-vs-distance-to-target correlation (r=-0.34, p=0.059) is closer to conventional significance but still short of it, and worth re-checking as more data becomes available.
All 6 Major changes in this dataset were tightening changes, so the tighten-vs-loosen comparison remains Minor-only. No data exists here on how a Major loosening change would behave.
The frequency-by-direction cross-tab (Figures 10 and 11) has very small cells (n=2 to 7 per combination). The consistency pattern (7-to-14 days = tightest spread) shows up in both metrics and both directions, which is reassuring, but with these sample sizes it should be treated as an early signal rather than a statistically confirmed effect.
One question checked but not included as a finding: whether the first Minor change after an extended dormant period (21-plus or 30-plus days with no changes) is more disruptive than a regular-cadence change. Short-term trough depth was mildly deeper for the dormant group (roughly 55% vs. 63% of baseline at the 21-day threshold, n=11 vs. n=29) but showed no real correlation across the full range of gap lengths (r=-0.17, p=0.30), and long-term outcomes flipped direction depending on the threshold used. Given the small samples and outlier sensitivity, this was not included as a standalone finding.
Conclusion
Across seven independent paid media campaigns, the size of a bid target change behaves less like a simple dial and more like a choice between two different tools. Minor changes are a low-risk, steady-tuning lever: a brief spend dip, a quick recovery, and a modest but fairly reliable nudge toward target. Major changes are a higher-variance lever: a deeper and longer spend cooldown, and outcomes on volume and efficiency that remain close to a coin flip even at the current Major-event sample size.
Two additional factors sharpen that picture. Direction matters as much as magnitude: tightening a target reliably costs volume while loosening reliably gains it, an asymmetry that shows up in both Minor and Major changes. And cadence matters more than intuition suggests: a 7-to-14-day gap between changes outperforms both faster and slower cadences, on average and in consistency. Taken together, these findings support a practical framework, favor Minor changes for routine tuning, reserve Major changes for situations that warrant their added risk and a longer monitoring window, and space changes 7 to 14 days apart wherever possible, over a one-size-fits-all rule for adjusting automated bid targets.
The dataset underlying this analysis will continue to grow as additional campaigns become available, and the findings here should be read as an evolving, directional picture rather than a final word. In particular, a confirmed Major-loosening example and a larger Major-change sample overall would meaningfully sharpen the guidance on Major changes, currently the least predictable lever in this study.


